There is a moment every year when HVAC systems stop tolerating shortcuts.
It does not happen during a mild day. It happens when demand spikes across the entire property at the same time. Systems that seemed fine suddenly fall behind. Small inefficiencies compound. Weak components fail in clusters, not in isolation.
Most teams think they have a maintenance problem when this happens. They do not. They have a preparation problem.
They tested systems under the wrong conditions. They trusted surface-level checks. They assumed that “working” meant “ready.” Nearly 80% of major HVAC component failures are caused by lack of maintenance.
It does not.
The operators who avoid peak-season chaos approach this differently. They do not prepare for HVAC season. They stress test for it. They actively try to break the system early, when failure is still manageable.
The 48-Hour Window That Actually Matters
The highest-performing teams do not stretch preparation across vague timelines. They compress execution into a focused window where everything is verified under pressure.
In that window, every unit is pushed close to real operating conditions. Not casually. Intentionally.
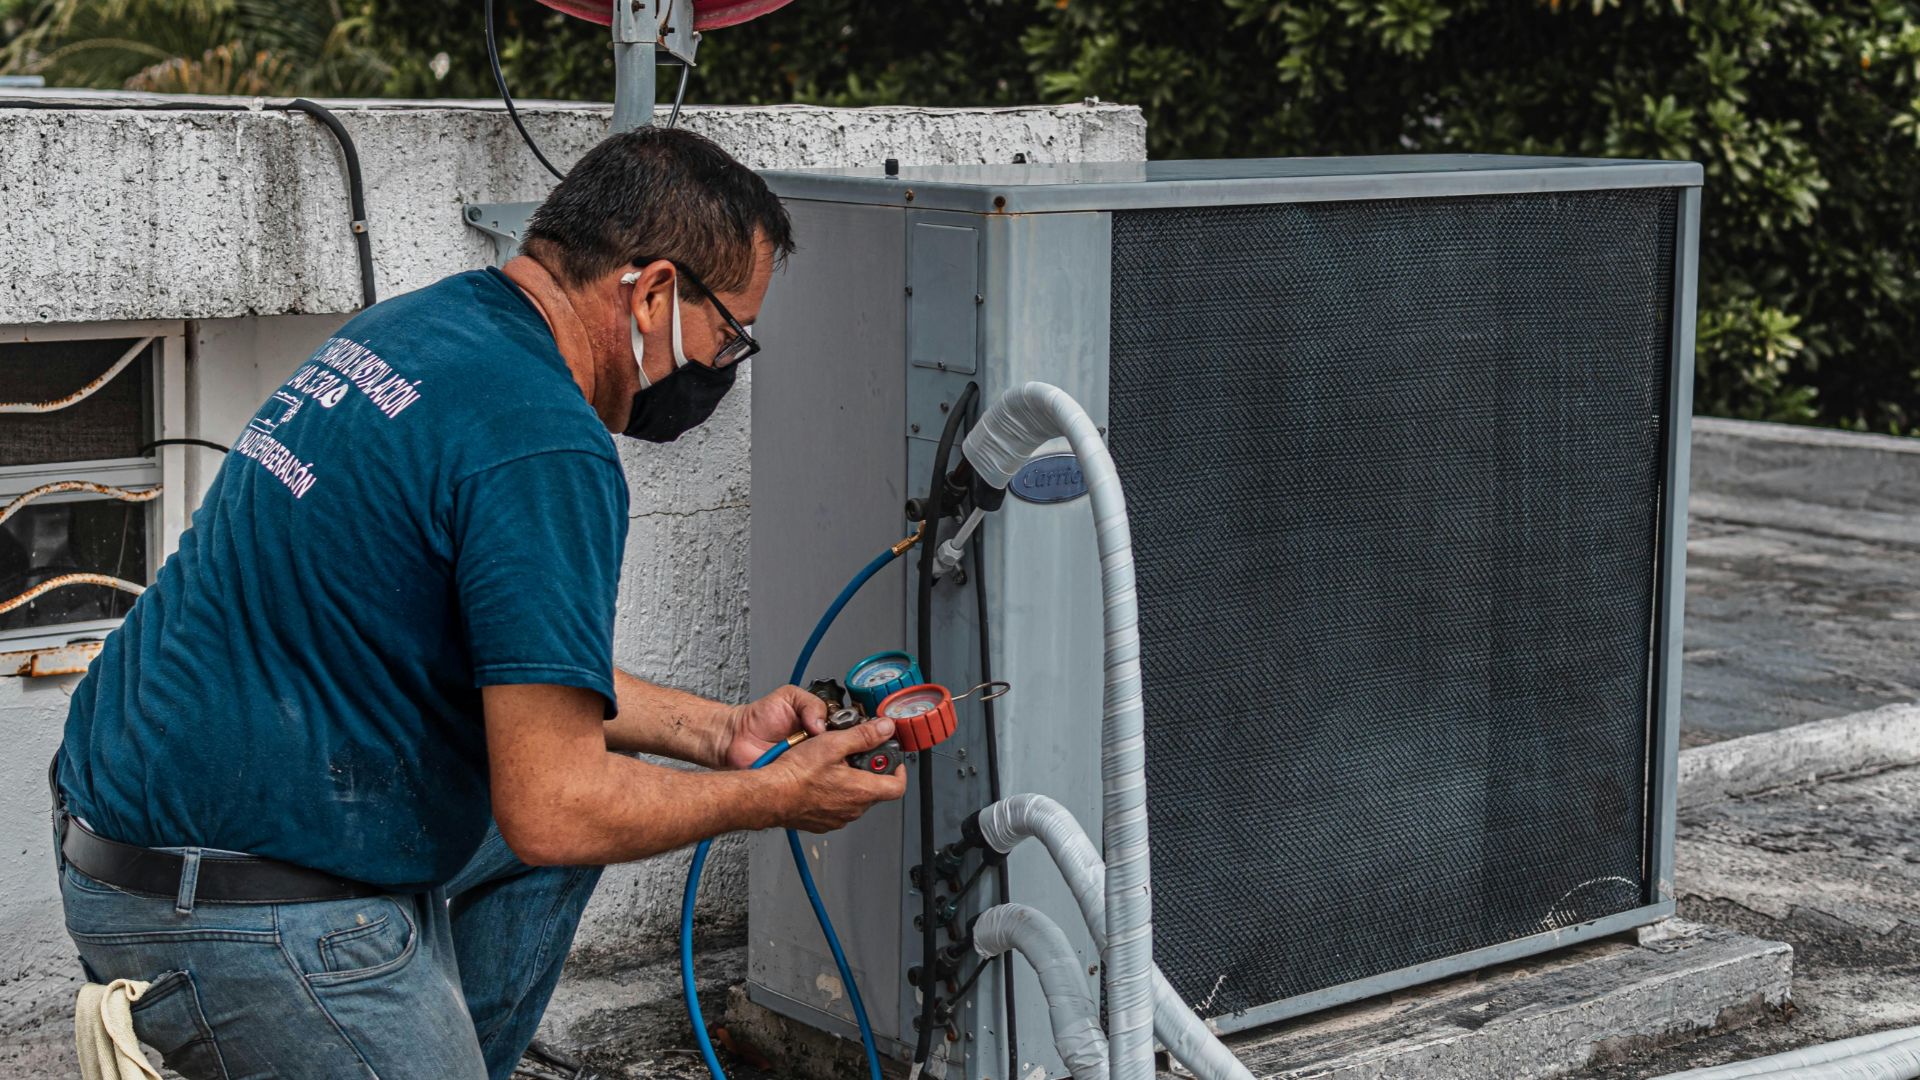
Running a system for a few minutes tells you almost nothing. Most failures do not show up immediately. They appear once the system has stabilized, once pressure builds, once the unit is forced to sustain output.
That is why each system should run in cooling mode for at least twenty minutes under near-peak settings. You are not checking if it turns on. You are checking how it behaves when it has to keep going.
This is where the first real signal appears.
The temperature split between supply and return air becomes a diagnostic tool, not just a number. Across identical units, that number should be consistent. When it is not, the system is already telling you where problems are forming.
One unit runs colder than the rest. Another struggles to maintain output. A third cycles too quickly. These are not minor differences. They are early indicators of failure.
Behavior matters as much as measurement. Compressors that hesitate before engaging. Units that shut off too quickly. Systems that run continuously but never quite reach the setpoint.
None of these trigger immediate alarms. All of them predict what will happen when demand increases.
The most overlooked signal is inconsistency between similar units. In a controlled environment, identical systems should perform similarly. When they do not, one of them is already drifting toward failure.
The Control Layer Is Where Most Problems Start
When residents complain about cooling, the assumption is usually mechanical failure.
In a surprising number of cases, the system itself is not the issue. The control layer is.
Thermostats that are slightly off calibration create a persistent sense of underperformance. A unit may be operating correctly, but the space never feels right. That gap between perception and performance drives service requests.
Response time is another hidden factor. When a thermostat change does not produce a quick reaction, the system feels unresponsive. Even if it eventually catches up, the experience is already negative.
Multiply that across dozens or hundreds of apartments and the pattern becomes clear. What looks like widespread equipment failure is often a network of small control inconsistencies.
Calibration needs to be precise. Not approximate.
Each thermostat should be tested for accuracy and observed for response behavior. When the setpoint changes, the system should react in a predictable and timely way. Delays suggest deeper issues, whether in communication, control boards, or system configuration.
Standardizing seasonal setpoints across units is not about restricting flexibility. It is about eliminating unnecessary variation. When every unit operates under different assumptions, the system as a whole becomes harder to stabilize.
Override behavior introduces another layer of complexity. Some residents adjust schedules or settings in ways that unintentionally create load imbalances. These are not edge cases. They are common, and they quietly strain the system.
Identifying these patterns early allows for correction before they cascade into larger issues.
Airflow Is the Fastest Way to Spot Hidden Failure
Airflow problems rarely present themselves clearly.
They show up indirectly. A room that never quite cools. A system that runs longer than expected. A unit that seems functional but inefficient.
By the time these symptoms are obvious, the system has already been under strain.
The faster approach is to evaluate airflow directly.
Every supply and return path needs to be verified. Not just checked, but understood. Is air moving as expected. Is anything restricting it. Even minor obstructions can shift the pressure balance of a system.
Pressure imbalance is one of the most overlooked drivers of HVAC failure. When airflow is restricted in one area, the system compensates elsewhere. That compensation increases load on key components.
Over time, that load turns into wear.
In apartment settings, resident behavior plays a larger role than most teams expect. Closed vents, blocked returns, furniture placement. Small decisions that make sense in the moment but disrupt system balance over time.
Catching these issues early is not about enforcement. It is about awareness and correction before the system absorbs the cost.
The Maintenance Work That Actually Changes Outcomes
Once systems have been tested under real conditions, the next step is not broad maintenance. It is targeted intervention.
Most breakdowns come from a small number of predictable causes. Addressing those directly delivers disproportionate results.
Filters and Coils Are Not Minor Details
There is a tendency to treat filters as routine. Replace them if they look dirty. Move on.
That approach creates risk. Dirty filters and coils can increase energy consumption by 15–30%.
Airflow restriction caused by filters is one of the most common drivers of system strain. It forces the system to work harder to achieve the same output. Over time, that extra effort compounds across components.
Replacing all filters, regardless of visible condition, removes that variable completely. It establishes a clean baseline.
Coils operate in the same space of risk. When they are coated with dust or buildup, heat transfer efficiency drops. The system compensates by running longer, increasing stress across the entire unit.
Cleaning coils is not cosmetic. It is operational.
In older buildings or high-density environments, upgrading filtration can extend the effectiveness of this work. Better filtration reduces buildup between maintenance cycles, which stabilizes performance over time.
Refrigerant Levels Define Real Performance
A system can be running and still be underperforming. HVAC systems can account for up to 40% of a building’s energy use.
Refrigerant levels are where that gap becomes visible.
When levels fall below specification, cooling capacity drops. The system compensates by increasing runtime. That extended operation accelerates wear across multiple components.
Measuring refrigerant against proper specifications is not optional. It is one of the clearest indicators of whether a system can sustain peak demand.
Leaks introduce long-term instability. Even small ones create pressure inconsistencies that grow over time.
The suction line is often overlooked, yet its insulation directly impacts efficiency. When insulation is compromised, energy is lost before it contributes to cooling.
Identifying underperforming units at this stage creates control. It allows decisions to be made proactively instead of reactively.
Moisture Management Is a Hidden Risk Layer
Water is a constant presence in cooling systems. When it moves correctly, it disappears into the background.
When it does not, problems escalate quickly.
Condensate lines must be clear and flowing. Partial blockages are especially dangerous because they do not fail immediately. They fail under peak conditions, when humidity is high and drainage demand increases.
Drain pans should not hold standing water. When they do, it signals a breakdown in proper flow.
Moisture also creates conditions for microbial growth, which affects both air quality and system performance. Over time, buildup from this environment contributes to airflow restriction.
Slope and drainage direction are small details that often go unchecked. When they are wrong, the system works against itself every time it runs.
At this point, most teams feel confident. Systems have been tested. Core maintenance is complete. Everything appears ready.
This is exactly where the biggest mistakes happen.
Because the most expensive failures rarely start in filters or drains. They start in the parts of the system that look fine, pass basic checks, and quietly degrade under load.
That is where we go next.
From System Prep to Portfolio Control: Why Most HVAC Strategies Break Under Pressure
By the time most teams feel “ready,” the real risks are just getting started.
Because the failures that hurt the most are not the obvious ones. They are not the completely broken units or the systems that never turned on. Those get caught early.
The expensive failures come from systems that passed inspection. Systems that looked fine. Systems that worked just well enough during testing, then collapsed under sustained demand.

This is where preparation stops being technical and starts becoming operational.
The question shifts from “Did we check everything?” to something far more important.
Did we identify what is most likely to fail, and act on it before it does?
The Shift from Unit-Level Thinking to Portfolio Control
Most HVAC strategies fail because they treat every unit the same.
In reality, every portfolio has a small percentage of systems that drive the majority of problems. Aging units. Systems with repeat service history. Equipment that has been slowly degrading without crossing a clear failure threshold.
If those units are not identified early, they will define your peak season.
A risk-based approach changes the equation.
Units nearing the end of their lifecycle, typically in the fifteen to twenty year range, should not be treated as stable assets. They are liabilities waiting for load. Preventive maintenance can reduce HVAC service requests by 31–50% across rental portfolios. If they have a history of complaints or inconsistent performance, that risk compounds.
Ranking systems by failure probability creates clarity. It allows teams to prioritize action instead of spreading effort evenly across the board.
This is where many operators hesitate. Replacing or heavily servicing a unit that is still technically running feels premature.
It is not.
It is controlled timing. The difference between planned intervention and emergency response.
Across multiple properties, patterns begin to emerge. The same model units fail in similar ways. Certain buildings show recurring airflow issues. Electrical weaknesses appear in clusters, not randomly.
Without a standardized inspection and logging system, these patterns stay invisible.
Consistency in how data is captured matters as much as the data itself. Filter changes, minor repairs, repeat complaints. When tracked in isolation, they seem routine. When aggregated, they tell a clear story.
That story is what allows teams to move from reactive maintenance to predictive control.
Execution also becomes more precise when roles are clearly defined.
Some work should never leave the in-house team. Filters, basic cleaning, visual inspections. These are high-frequency, low-complexity tasks that benefit from speed and consistency.
Other work requires specialized expertise. Refrigerant handling, electrical diagnostics, airflow testing. These are areas where precision matters more than speed.
The strongest operations do not choose one or the other. They build a hybrid model that keeps routine work internal while deploying vendors for high-skill interventions.
It is not about cost alone. It is about control.
The Failure Patterns That Keep Repeating
Every peak season produces the same surprises for teams that are not looking closely enough.
The first is the system that was “working fine.”
It passed inspection. It cooled during testing. It did not raise any immediate concerns.
Then the temperature rises, demand increases, and the system fails.
This happens because most testing is done under mild conditions. Systems are never pushed to sustain performance. Weaknesses remain hidden until the exact moment reliability matters most.
Stress testing is not an extra step. It is the only way to validate readiness.
The second pattern is filter neglect.
Not in the obvious sense. Not completely clogged filters that have been ignored for months.
It is the assumption that a filter that looks acceptable is acceptable.
Slight restriction is enough to shift airflow. That shift increases system strain. Operational HVAC faults can increase energy consumption by 20% or more. Under peak demand, that strain becomes failure.
This is one of the most preventable issues in HVAC operations, and it continues to be one of the most common.
The third pattern is small electrical weakness.
Loose connections. Slight corrosion. Capacitors that are just below optimal performance.
None of these trigger immediate alarms. They pass visual inspection. They allow the system to operate.
Until load increases.
At that point, resistance generates heat. Components degrade rapidly. What was a minor issue becomes a full failure.
These are not rare events. They are predictable outcomes of missed detail.
Then there is the human factor.
Resident behavior introduces variables that no system design fully accounts for. Closed vents. Blocked returns. Thermostat adjustments that disrupt balance.
Individually, these actions seem insignificant. Collectively, they create uneven load distribution across a building.
Some units become overworked while others remain underutilized. The system drifts away from equilibrium.
Ignoring this variable does not eliminate it. It just delays its impact.
The Timeline That Separates Control from Chaos
Preparation is not just about what gets done. It is about when it gets done.
Timing compresses or expands your margin for error.
Sixty days before peak season is where the real work begins.
This is the window for full inspection across all units. Not selective checks. Complete visibility.
At this stage, the goal is identification. Which systems are underperforming. Which components show early signs of failure. Which units are approaching the edge of reliability.
This is also when parts should be ordered.
Waiting until demand increases to source components introduces unnecessary risk. Lead times stretch. Availability tightens. What could have been a planned repair becomes a delayed response.
Thirty days before peak season is where execution takes over.
Repairs and replacements should be completed in this window. Not scheduled. Completed.
Coils should be cleaned thoroughly. Ductwork addressed where needed. Outdoor units cleared and stabilized.
At this point, the system should not just be functional. It should be optimized.
Seven days before peak season is the final validation phase.
This is where systems are tested again under load. Not to discover new problems, but to confirm that previous issues have been resolved.
Performance consistency becomes the focus.
Units should behave predictably across the portfolio. Variations should be minimal. Any remaining inconsistencies should be addressed immediately.
This final check is what converts preparation into confidence.
Standardization Is What Makes Scale Work
At a single property, informal processes can hold things together.
Across multiple properties, they fail.
Standardized checklists are not about bureaucracy. They are about reliability.
At the unit level, execution should be repeatable. Startup behavior verified. Runtime observed. Shutdown confirmed. Thermostats calibrated. Filters replaced. Coils cleaned. Refrigerant checked. Drain lines cleared. Electrical connections secured. Airflow validated.
At the building level, systems that affect multiple units need equal attention. Ventilation must operate as intended. Ductwork must be intact and sealed. Outdoor units must be clear and functional.
At the portfolio level, the focus shifts again. High-risk units should be flagged and scheduled for intervention. Replacement planning should be current, not reactive. Vendor inspections should be completed with accountability.
When these layers align, operations stop relying on memory and experience alone. They become structured, repeatable, and scalable.
Measuring What Actually Matters
Most teams track activity.
Few track effectiveness.
The difference shows up during peak season.
Operational metrics provide the first signal. The percentage of units that pass initial inspection without issue. The number of emergency work orders once demand spikes. The speed at which repairs are completed.
These numbers reveal whether preparation translated into stability.
Financial metrics tell a different story. The ratio of preventive to reactive maintenance spending. Energy costs before and after optimization. Capital expenses that were avoided because failures were prevented instead of responded to.
These are not abstract figures. They reflect the cost of strategy versus the cost of delay.
Then there is the resident experience.
Complaints per hundred units. Temperature consistency across apartments. Satisfaction with maintenance response.
These are often treated as soft metrics. They are not.
They are direct indicators of system performance under real conditions.
When these numbers improve, it is not because communication improved. It is because the system itself became more reliable.
The Upgrade Most Teams Postpone
Even with strong execution, many operations stop short of the next step.
They maintain well. They respond quickly. They improve incrementally.
But they do not evolve.
Predictive maintenance changes the model entirely. Predictive maintenance can reduce breakdowns by 70–75% and cut maintenance costs by up to 35%.
Instead of reacting to failures or even preventing known issues, it uses historical data to anticipate what will fail next.
Units with repeat issues become priority targets. Components with known failure patterns are replaced before they degrade.
This is not theoretical. The data already exists in most operations. It is just not being used to its full potential.
Digital workflows accelerate this shift.
Paper checklists create friction. They delay visibility. They make pattern recognition difficult.
Mobile systems change that. Inspections are logged in real time. Data becomes immediately accessible. Trends become visible across properties.
Reminders for filter changes, inspections, and follow-ups become automated. Consistency improves without increasing effort.
Over time, a feedback loop develops.
Peak-season failures are analyzed after the fact. Not to assign blame, but to refine the system.
What was missed. What could have been predicted. What patterns are emerging.
Checklists evolve. Vendor performance becomes measurable. Response times improve.
The system learns.
And when the system learns, peak season stops being unpredictable.